指数上涨,自己的股票却下跌,并不矛盾。看懂它,可以把三件事分开:指数由谁推动,有多少股票上涨,自己的资金放在哪里。
一、指数里的股票,分量可能不同
有些指数按市值或调整后的市值加权,权重越大的股票,相同涨跌幅带来的影响越大。也有等权重等方法,具体要看各自的官方编制方案。
二、三只股票,就能看清区别
以下完全是虚构案例,不对应真实指数或股票。只演示一个交易日,假定没有分红、除权或样本调整。
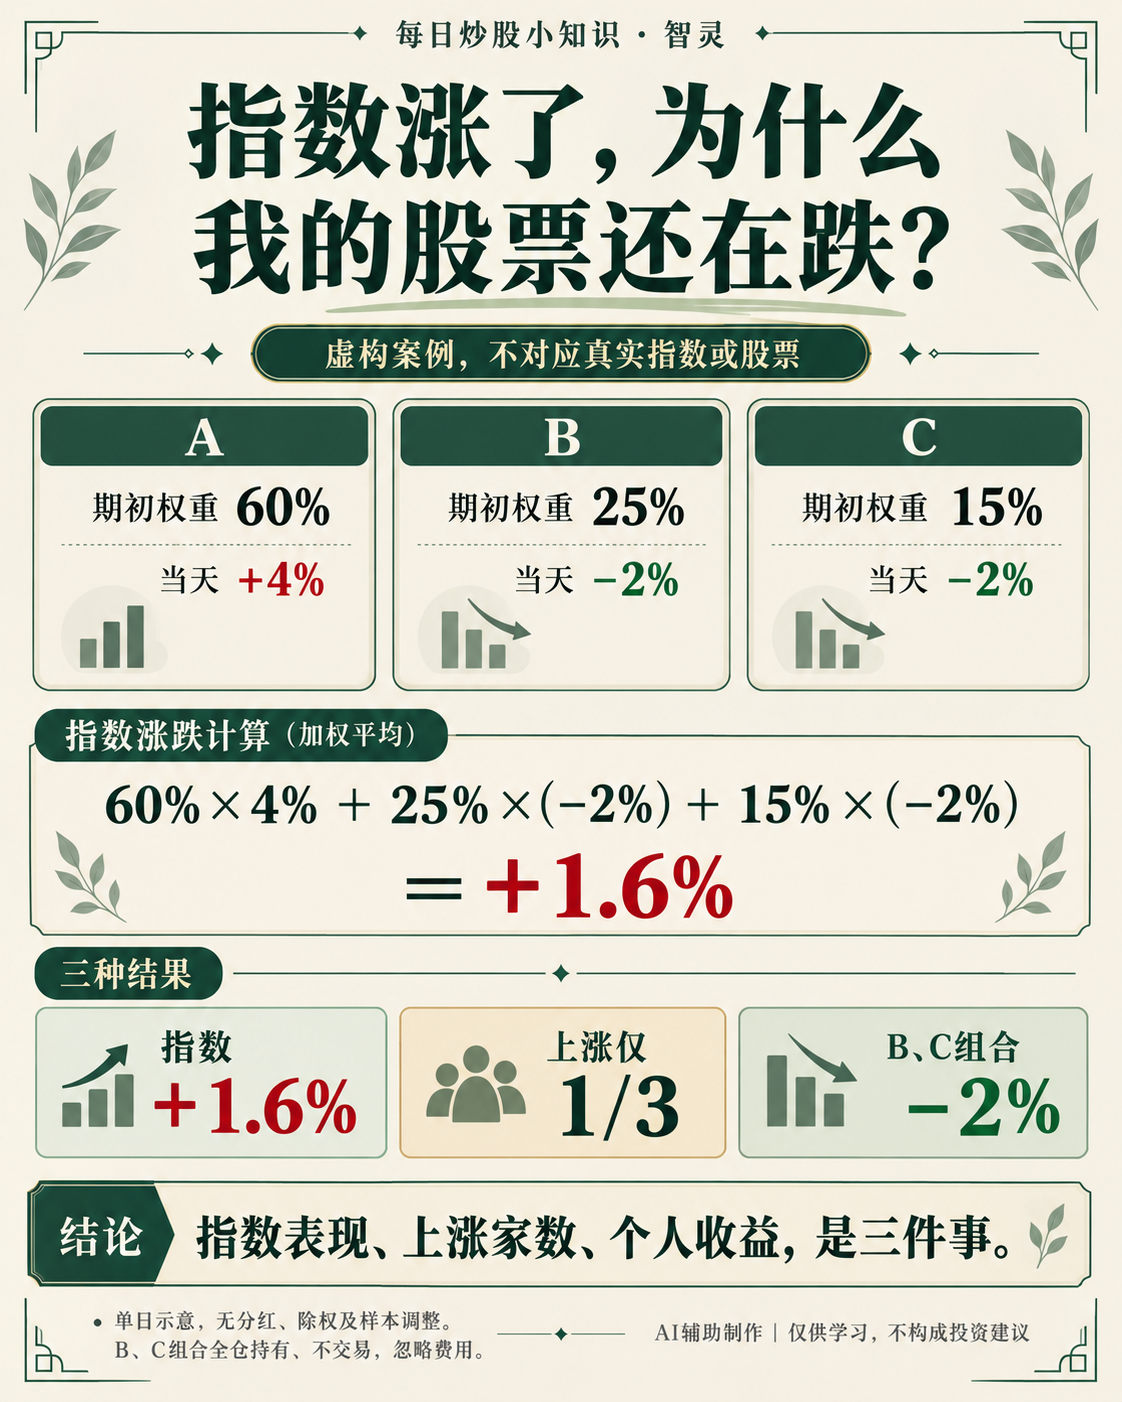
某指数期初为100点,只有三只股票:
- A:期初权重60%,当天上涨4%
- B:期初权重25%,当天下跌2%
- C:期初权重15%,当天下跌2%
指数涨跌幅=60%×4%+25%×(-2%)+15%×(-2%)=1.6%。
指数升到101.6点,三只股票却只有一只上涨。A贡献2.4个百分点,B、C合计拖累0.8个百分点。若一个模拟账户全天只持有B、C且不交易,忽略费用,当天股票组合就下跌2%。
三、上涨家数,看的是参与范围
市场广度关注有多少股票参与一轮涨跌,可以先看上涨、下跌和平盘家数。例子里指数上涨,但上涨家数只占三分之一,说明上涨集中。
比较时要统一日期、时点和统计范围。沪深A股、沪深北A股、某个指数的样本,覆盖对象可能不同;停牌、平盘等处理也要核对。家数能补充指数信息,却不能单独证明下一步会涨还是会跌。
四、账户盈亏,还要回到自己的组合
个人收益取决于持有哪些股票、各占多少资金,以及买卖时点、现金比例和交易成本。即使多数股票上涨,集中持有弱势行业,也可能亏损。比较表现时,还要用同一时间段,别拿今日指数涨幅对照账户自买入以来的盈亏。
看盘时,可以依次问:涨的是哪个指数?上涨是否扩散?自己的组合与它有什么差别?先把事实看清,再判断风险,不必看到指数翻红就急着追赶。
道法自然,知止有度。本文由AI辅助撰写,案例为虚构,仅供学习交流与参考,不构成个股推荐或投资建议;市场有风险,决策须独立。
接着读:
参考:沪深300编制方案 · 深证成份等权重指数编制方案 · 纳斯达克:市场广度
English version
Why Is My Stock Still Falling When the Index Is Rising?
There is no contradiction when an index rises while your own stock falls. To understand this, separate three things: what is driving the index, how many stocks are rising, and where your own money is invested.
1. Stocks in an Index May Carry Different Weights
Some indexes are weighted by market capitalization or adjusted market capitalization. The greater a stock’s weight, the greater the effect of the same percentage rise or fall. Other methods, such as equal weighting, also exist; check each index’s official methodology for the specifics.
2. Three Stocks Are Enough to Show the Difference
The following example is entirely fictional and does not represent any real index or stock. It illustrates just one trading day, assuming no dividends, ex-rights adjustments, or constituent changes.
An index starts at 100 points and contains only three stocks:
- A: an opening weight of 60%, rising 4% that day
- B: an opening weight of 25%, falling 2% that day
- C: an opening weight of 15%, falling 2% that day
Index percentage change = 60% × 4% + 25% × (−2%) + 15% × (−2%) = 1.6%.
The index rises to 101.6 points, yet only one of the three stocks rises. A contributes 2.4 percentage points, while B and C together subtract 0.8 percentage points. If a simulated account holds only B and C throughout the day and makes no trades, its stock portfolio falls by 2% that day, ignoring costs.
Illustration: In this fictional example, A has a 60% weight and rises 4%; B has a 25% weight and falls 2%; C has a 15% weight and falls 2%. The index rises 1.6%, while a portfolio holding only B and C falls 2%.
3. The Number of Advancing Stocks Shows the Breadth of Participation
Market breadth looks at how many stocks participate in a rise or fall. You can start with the numbers of advancing, declining, and unchanged stocks. In the example, the index rises, but only one-third of the stocks advance, showing that the gains are concentrated.
When making comparisons, use the same date, observation time, and coverage. Shanghai and Shenzhen A-shares, Shanghai, Shenzhen, and Beijing A-shares, and the constituents of a particular index may cover different sets of stocks. You also need to check how suspended and unchanged stocks are treated. These counts can supplement index information, but cannot on their own establish whether the market will rise or fall next.
4. Your Account’s Gains and Losses Come Back to Your Own Portfolio
Your personal returns depend on which stocks you hold, how much money is allocated to each, when you buy and sell, your cash allocation, and trading costs. Even if most stocks rise, a concentrated position in a weak industry can still lose money. When comparing performance, use the same time period: do not compare today’s index gain with your account’s gain or loss since purchase.
When watching the market, ask in order: Which index is rising? Are the gains spreading? How does your own portfolio differ from it? Understand the facts before assessing risk; there is no need to rush to chase gains just because the index turns positive.
Follow the natural course; know when to stop and keep within limits. This article was written with AI assistance. The example is fictional and is for learning, discussion, and reference only. It does not constitute a recommendation of any individual stock or investment advice. Markets involve risk; make your own decisions independently.
Read next:
Is a 5-Yuan Stock Really Cheaper Than a 50-Yuan Stock?
Brief A-Share Market Closing Review for October 8
References: CSI 300 Index Methodology · Shenzhen Component Equal Weight Index Methodology · Nasdaq: Breadth of the Market